Live roof models · no sign-up
Every roof line, measured from the sky.
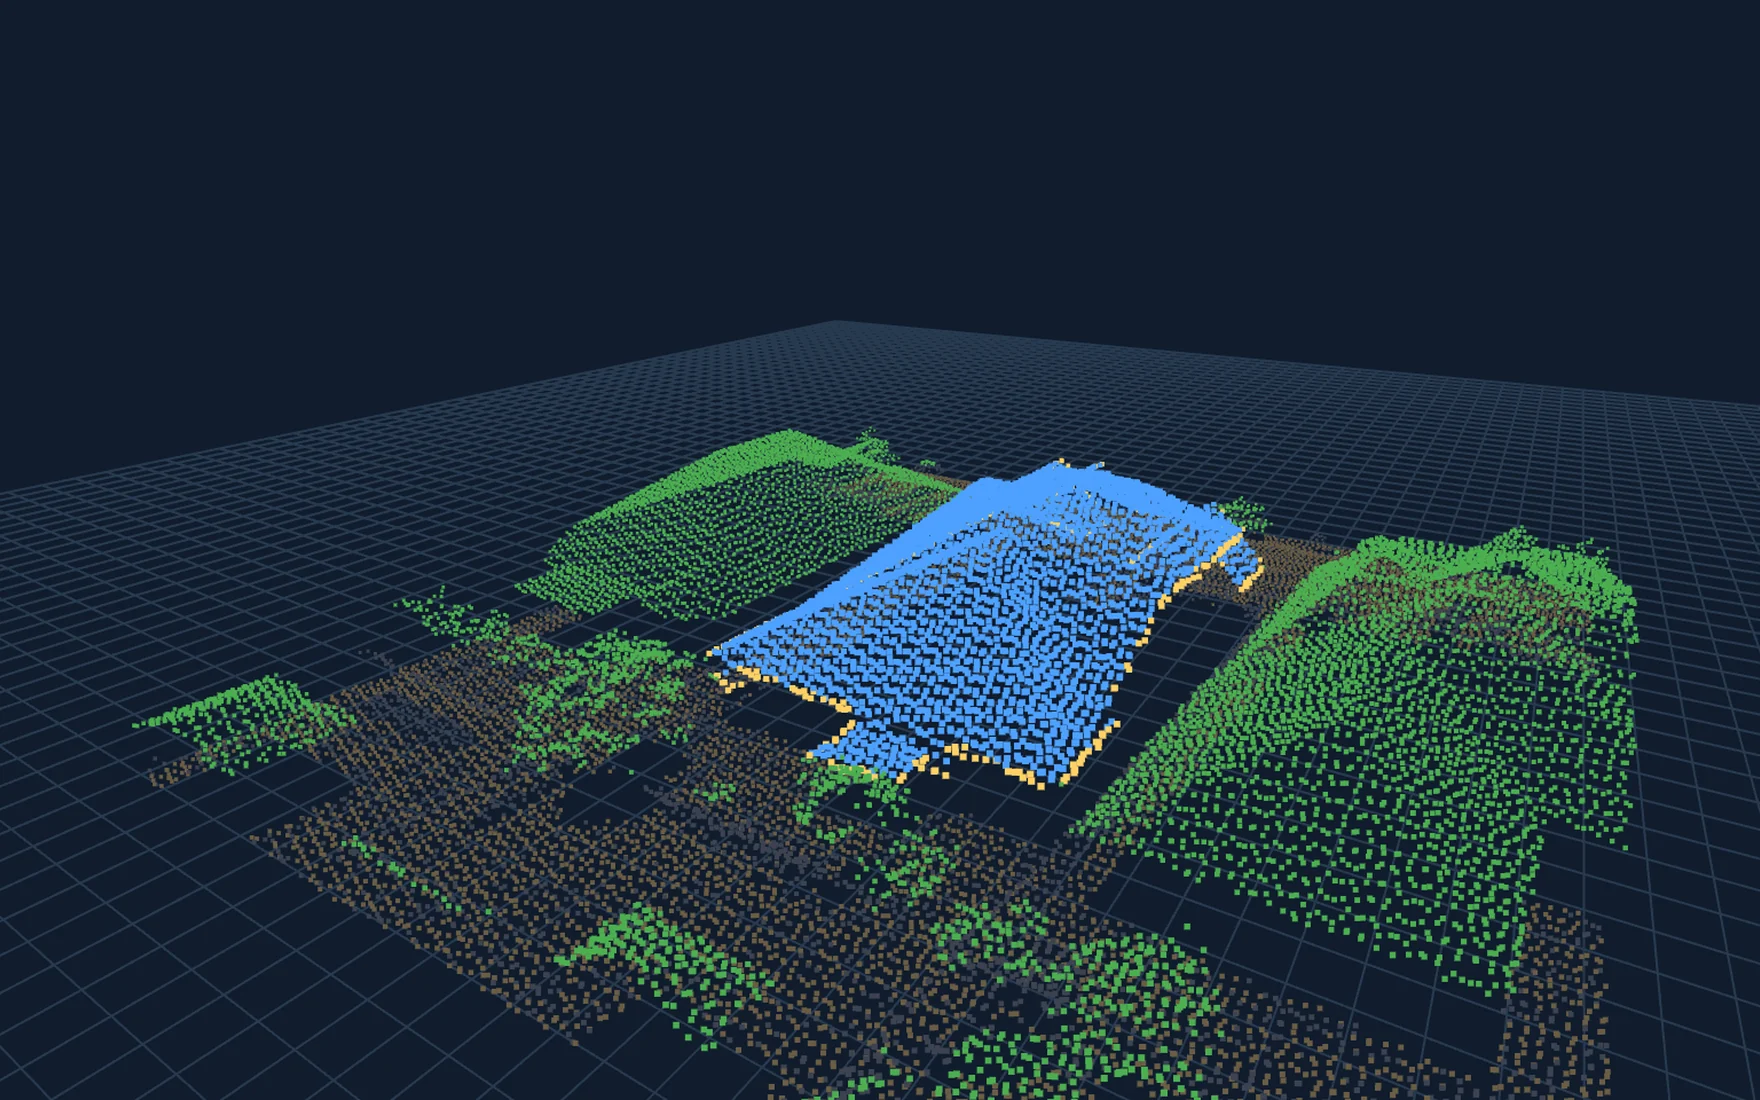
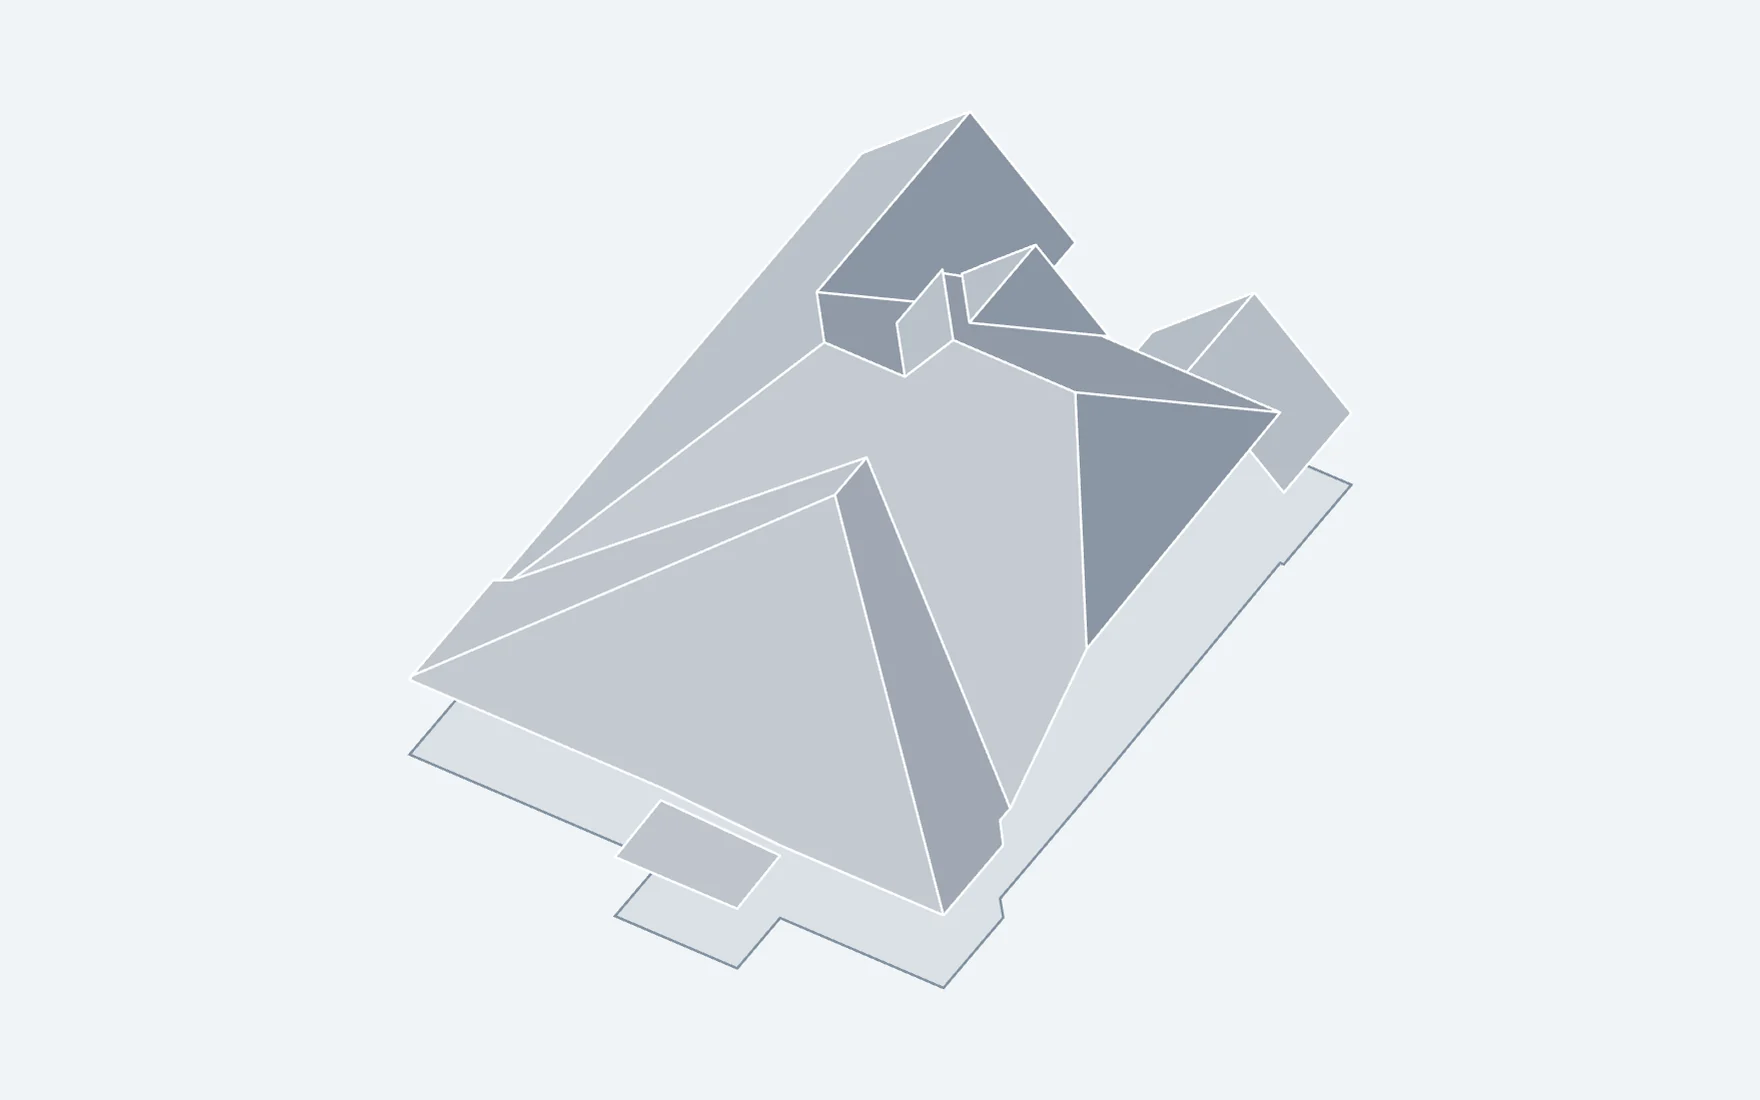
Type an address and watch the roof come together. RoofLine360 rebuilds it in 3D from aerial LiDAR in seconds, with slope areas, pitches, edge lengths, a material takeoff, solar potential and a report you can hand to the customer.
- Roof surface
- 5,718.9 ft²
- Slopes
- 15
- Main pitch
- 11.9/12
- Peak height
- 32.1 ft
- Panels placed
- 78
- System size
- 33.5 kW DC
- Harvest by slope
- LowHigh
- Generation
- 41,076 kWh/yr
Pick up where you left off
All propertiesFrom address to order list
-
01
Enter the address
We find the building and gather the aerial LiDAR around it: tens of thousands of laser measurements of the roof, the trees and the ground.
-
02
We rebuild the roof
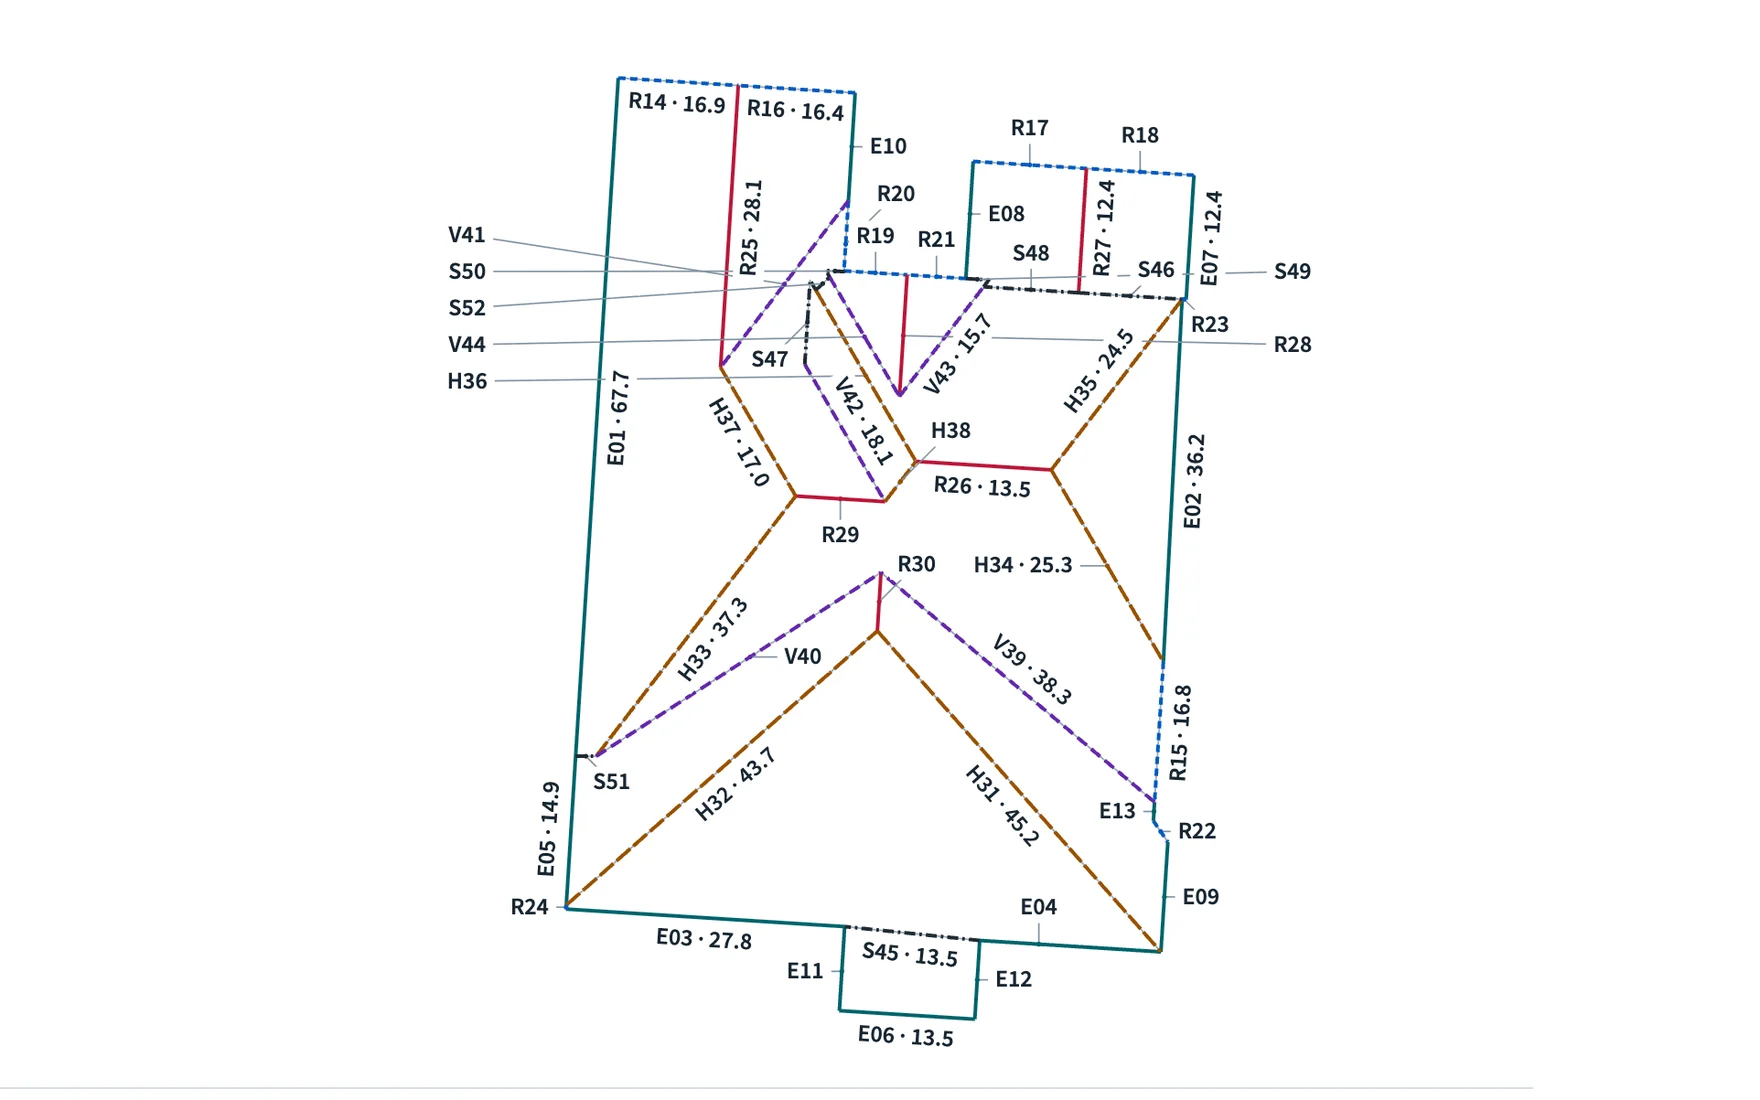
Roof planes are fitted to the returns, and ridges, hips, valleys, eaves and rakes are traced where those planes meet. It runs live and takes seconds, not a site visit.
-
03
Measure and order
Inspect the model, check every edge on the plan, set waste and bundle rate, then download a PDF report for the crew or the customer.
Three ways to read a roof
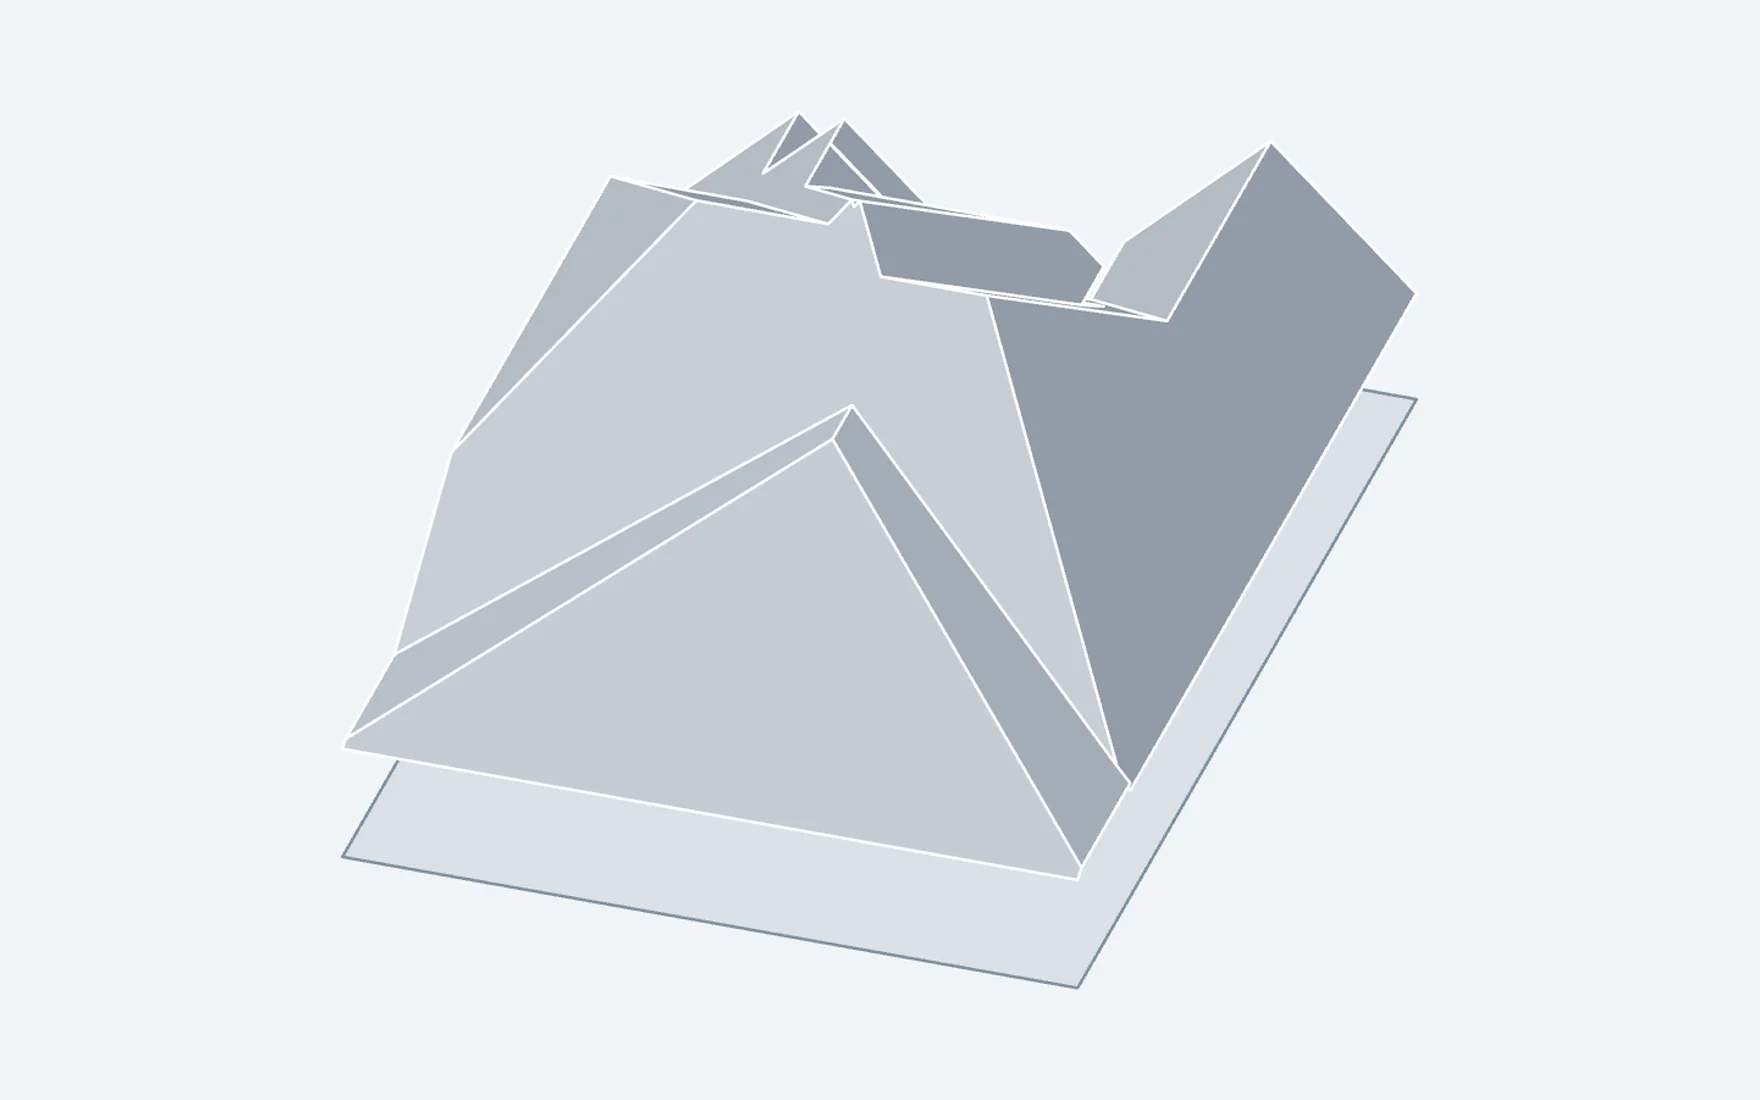
Which slopes are worth panels
Every roof plane is scored for solar harvest, then checked against the shade that trees, neighbors and the roof itself cast through the year.
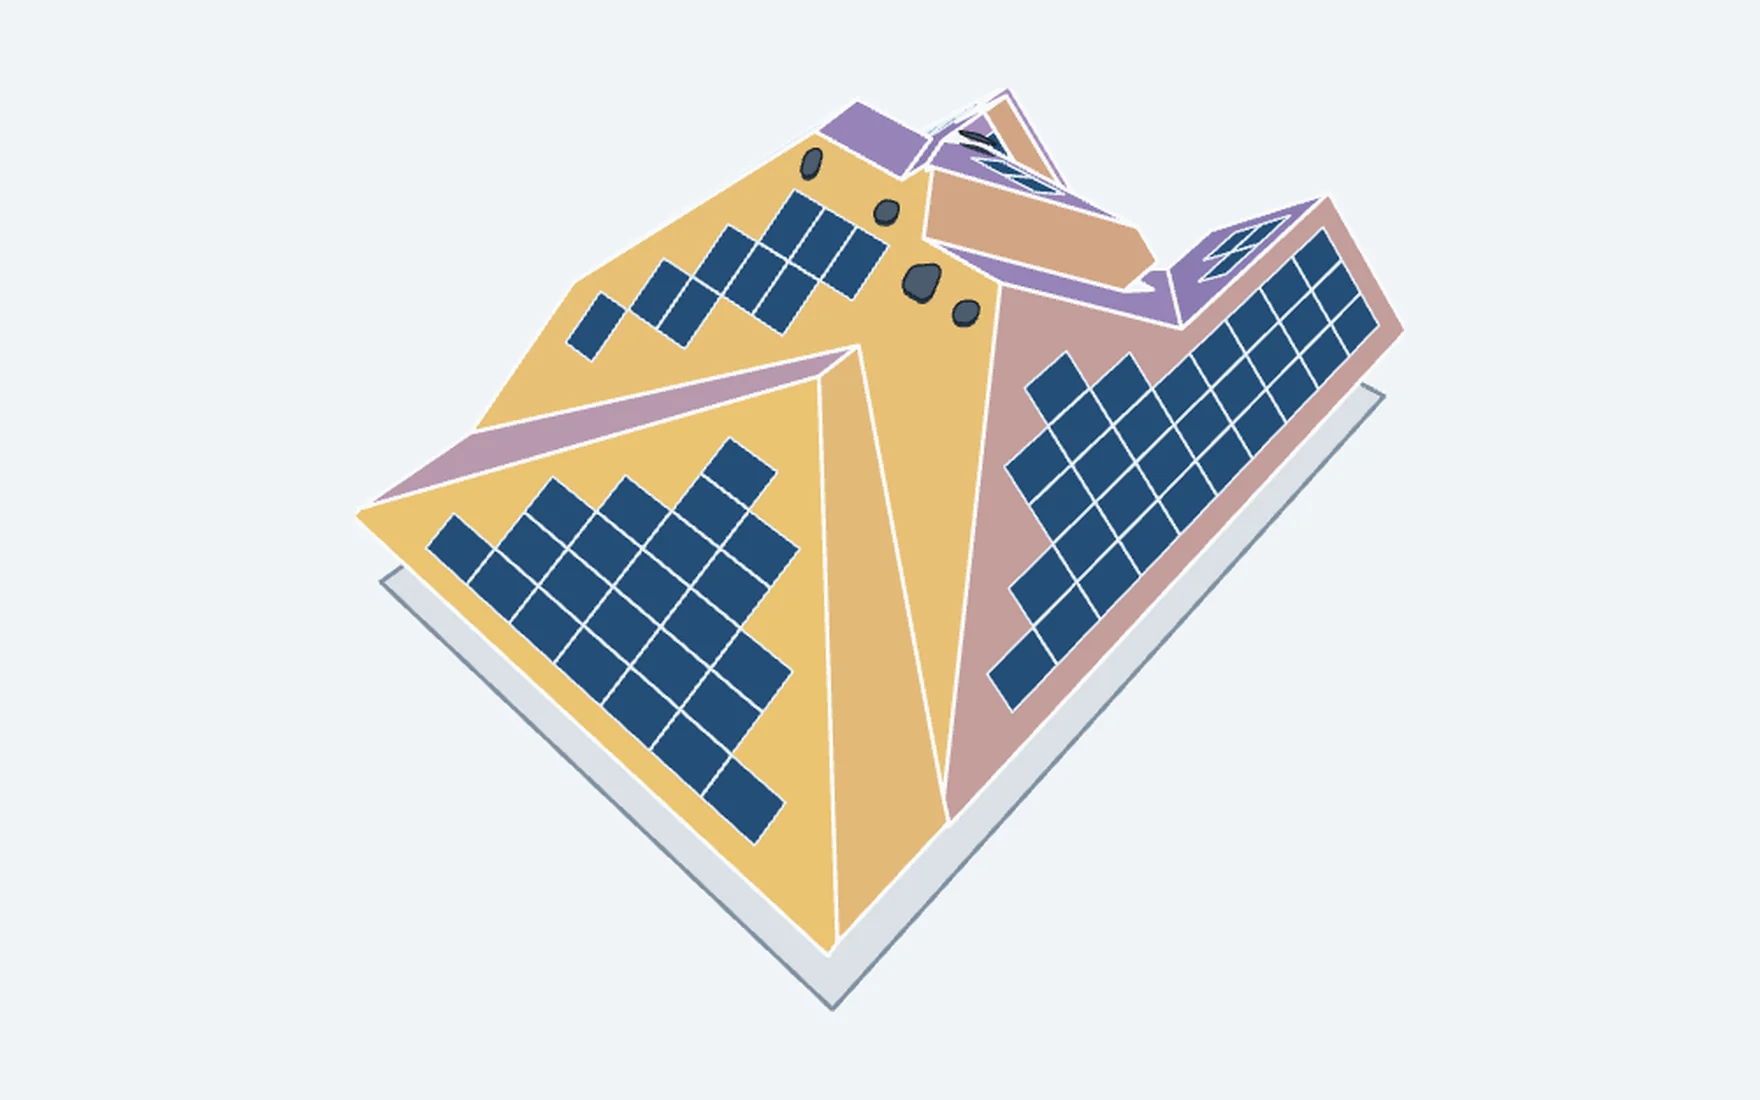
Harvest by slope
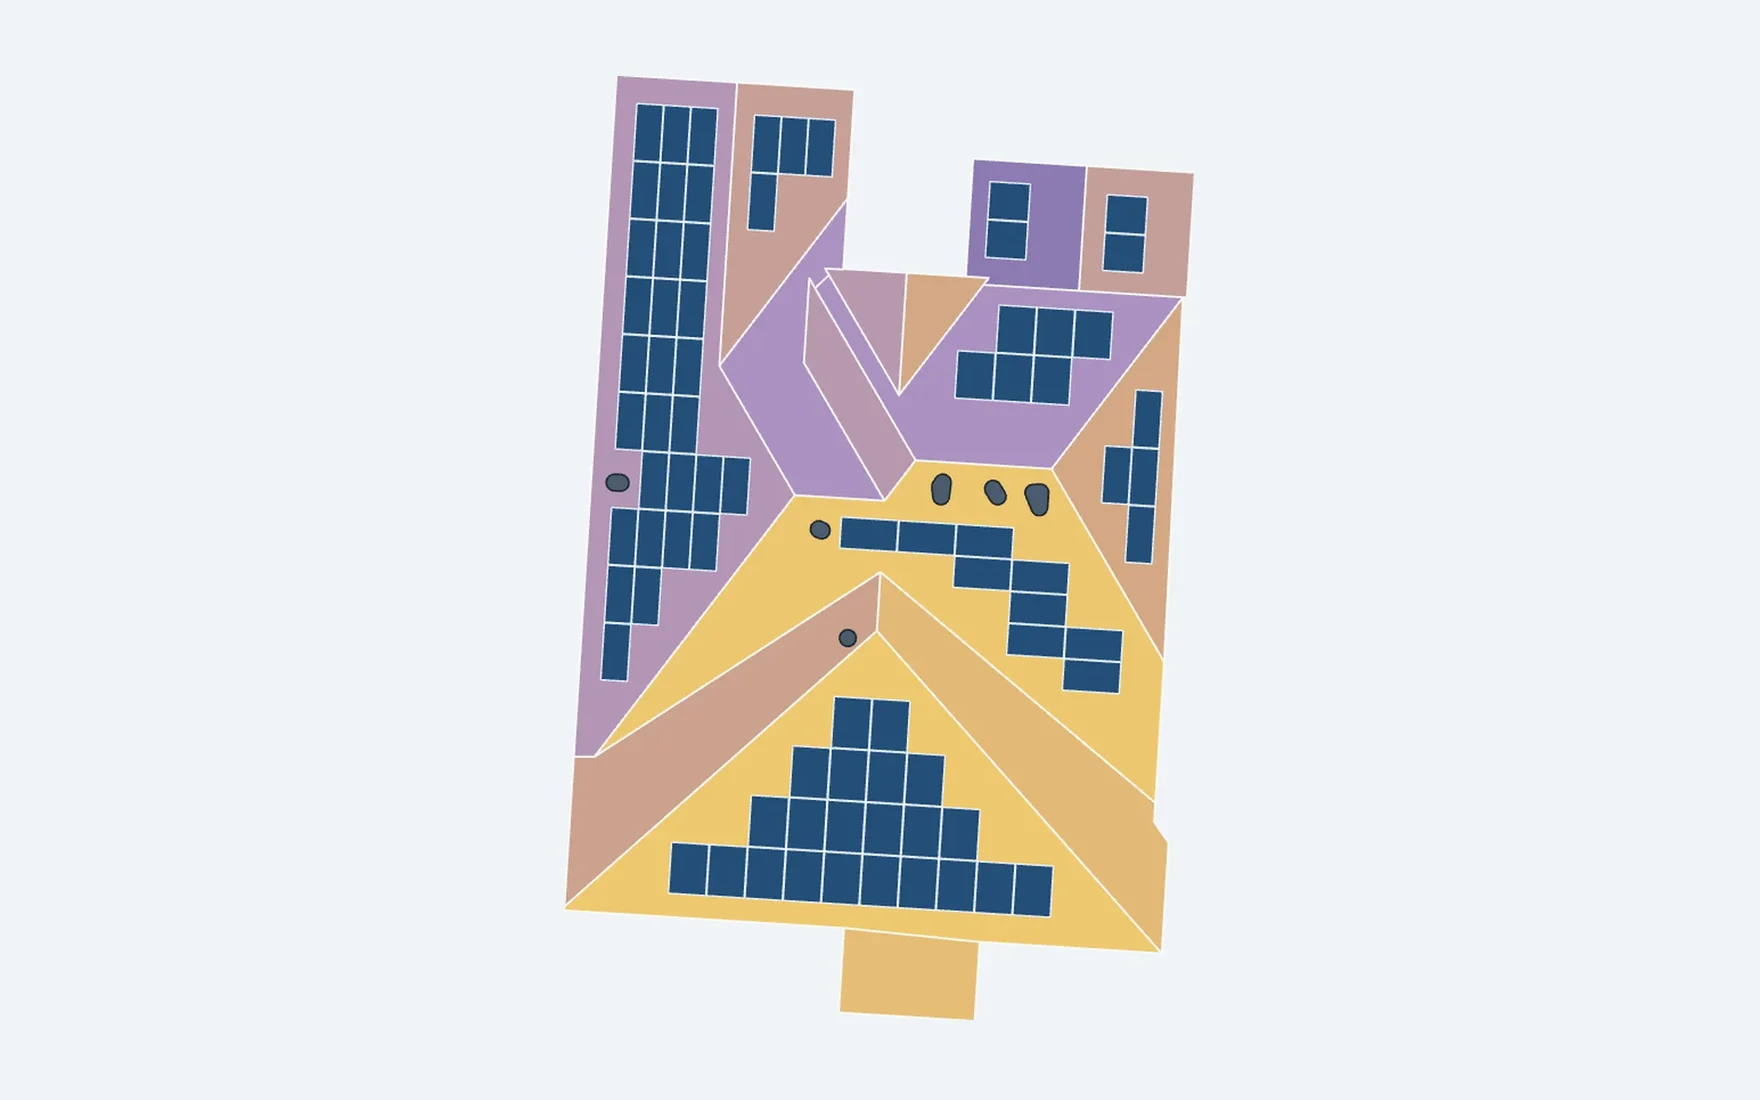
Each slope is colored by its yearly yield per installed kilowatt, from orientation, tilt and a typical weather year at the address. Layouts place panels only where they pay off, around edges and vents.
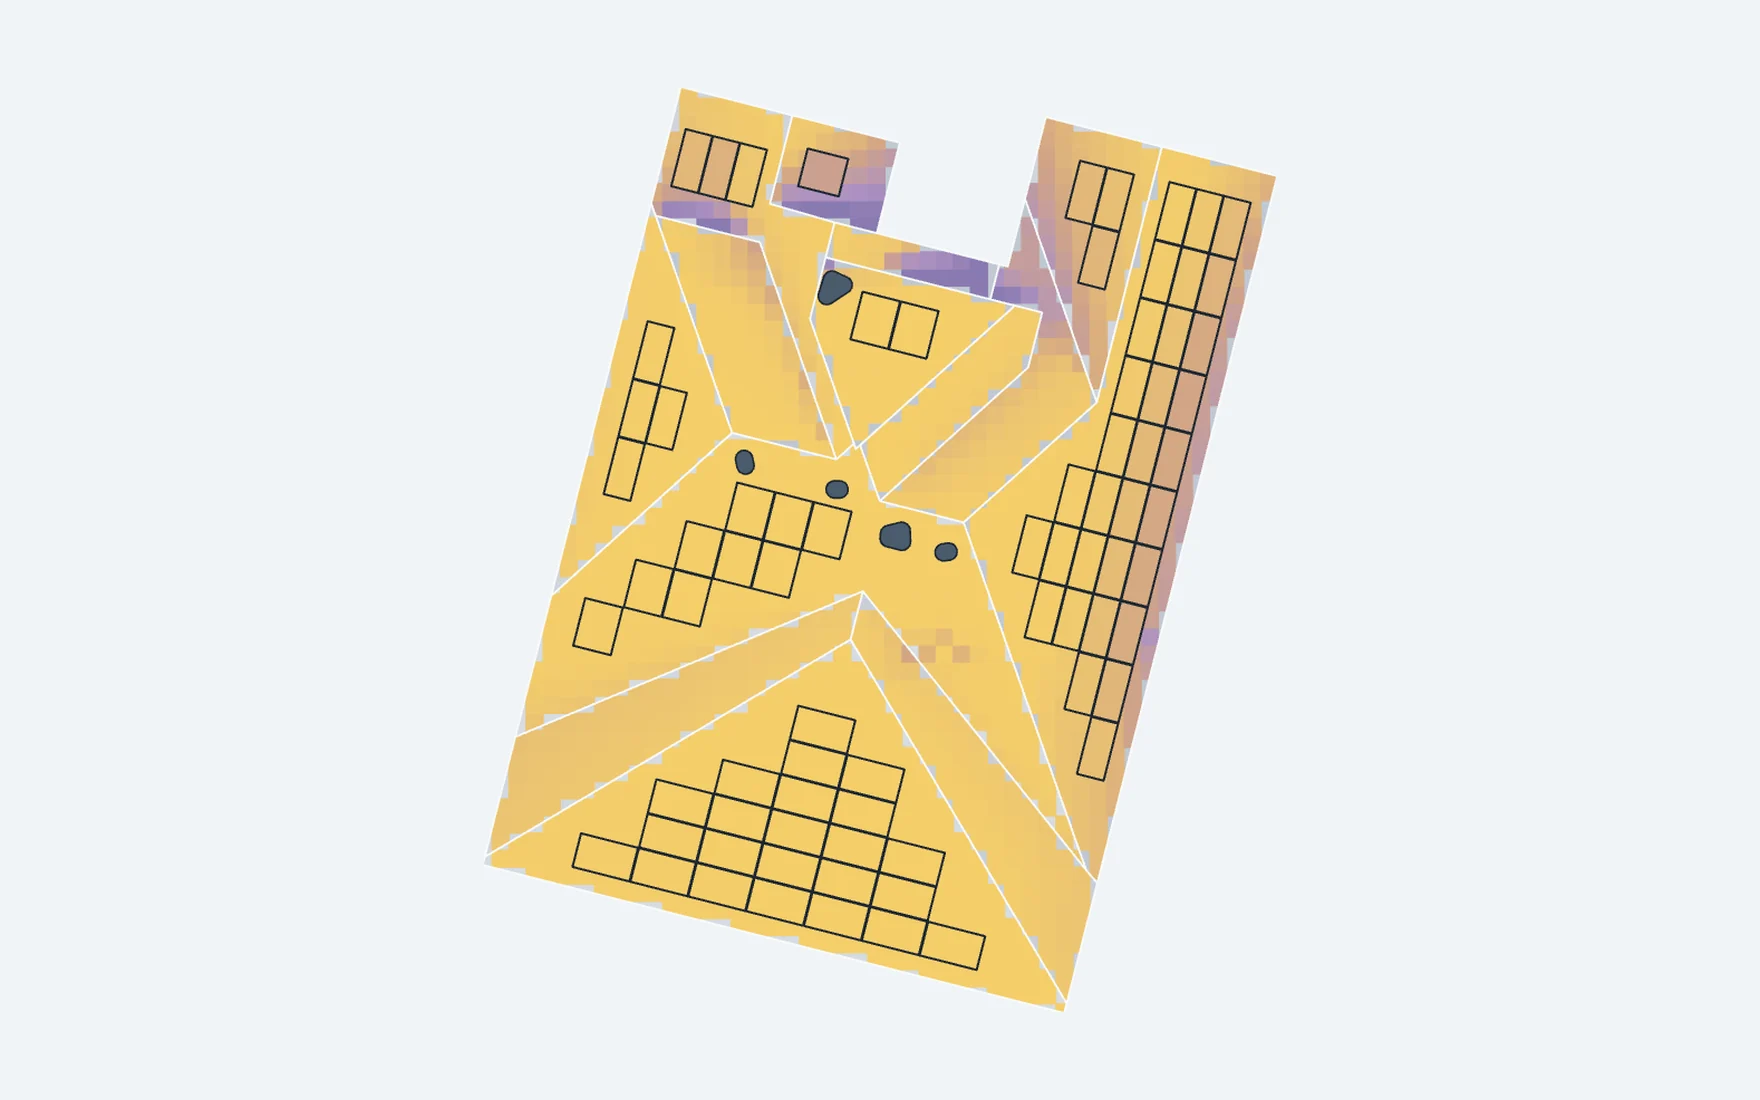
Shade model
Shade is traced on the LiDAR surface within about 35 m of the house: tree crowns, neighboring buildings and the roof's own ridges. Each spot gets its share of open-sky sunlight, and every panel loses output for the shade it sits in.
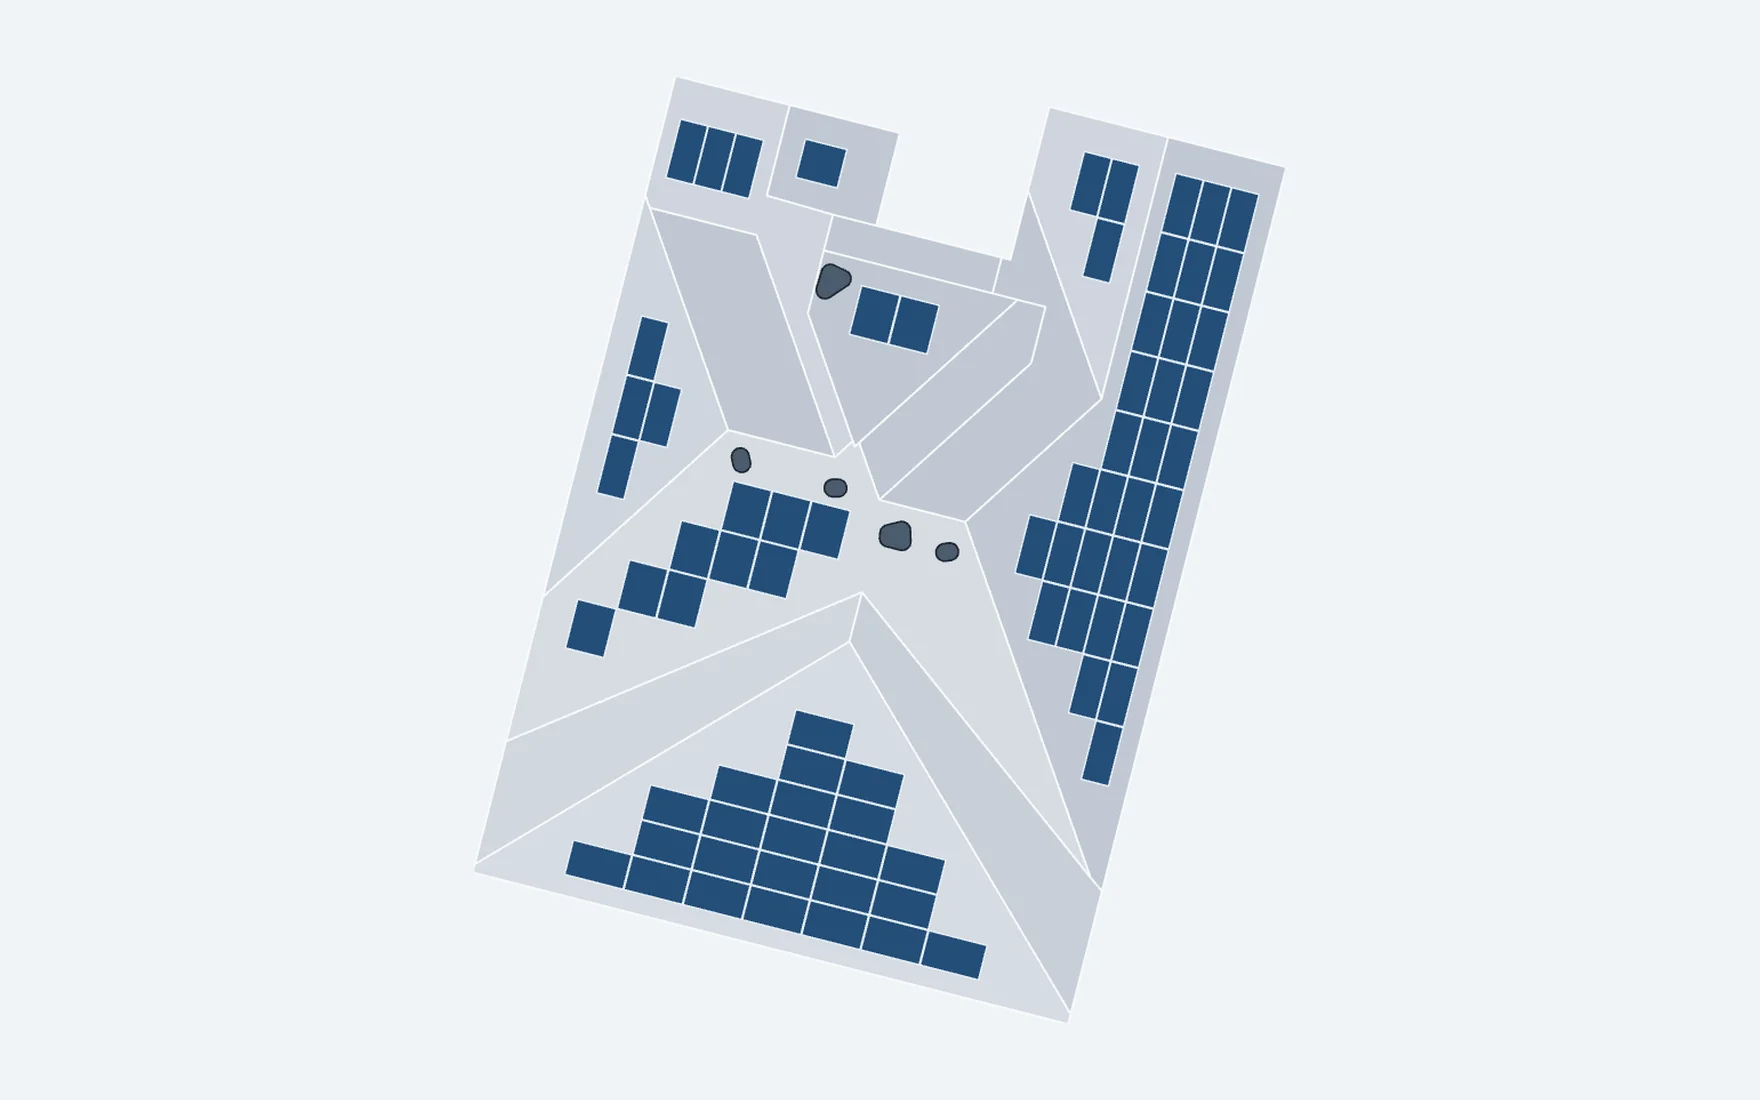
Panel layout, designed for you
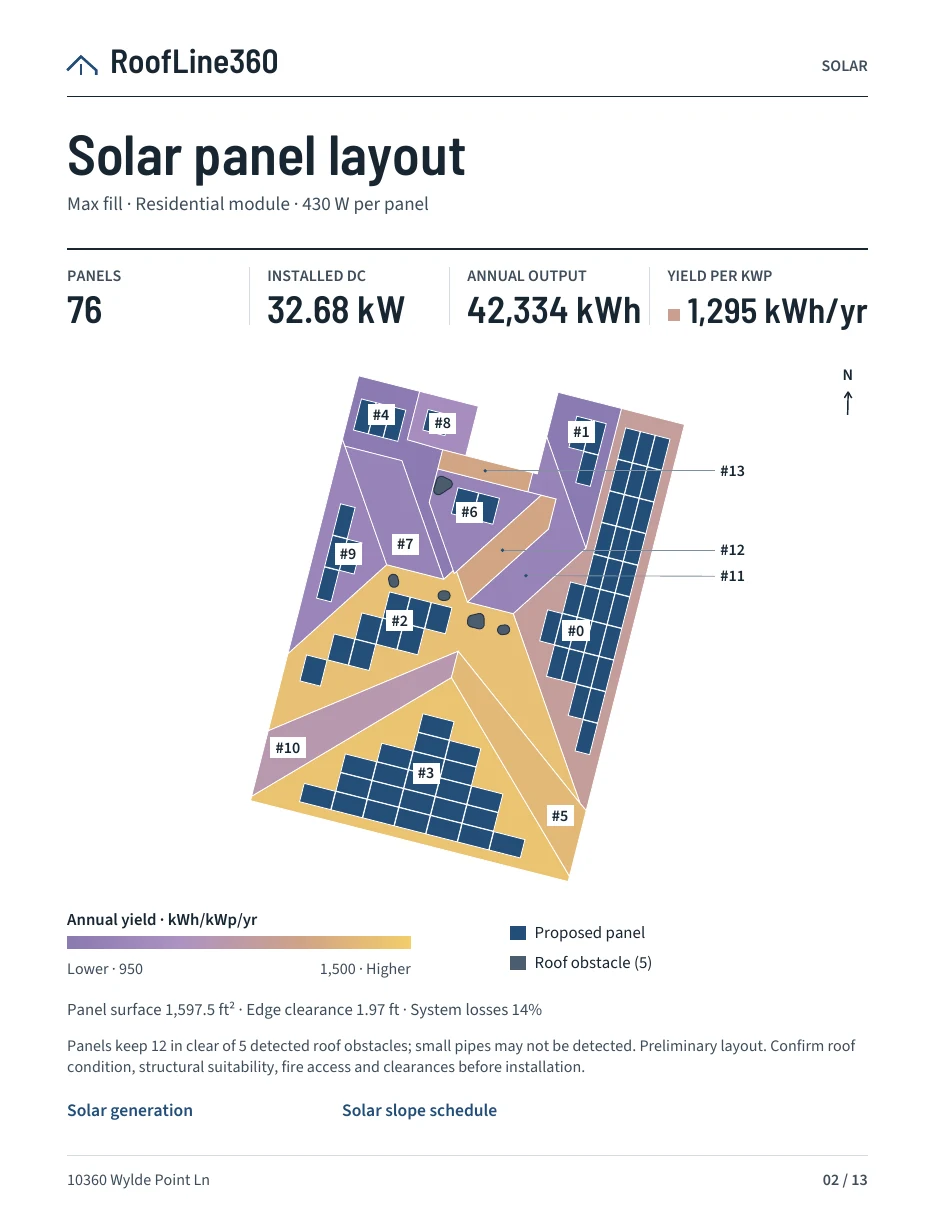
RoofLine360 places real module sizes on the actual roof planes, keeps them clear of edges and vents, and compares layouts side by side. Switch a slope on or off in the plan or in 3D and every number updates.
| Layout | Panels | kW DC | kWh/yr |
|---|---|---|---|
| Best sun | 46 | 19.78 | 27,905 |
| Max fill | 76 | 32.68 | 42,334 |
| Portrait | 65 | 27.95 | 36,527 |
| Landscape | 75 | 32.25 | 41,864 |
- Module presets from 120 to 720 W, or a custom size
- Edge clearance presets from 0.60 m down to a fit-to-edges preview
- Best sun keeps only panels within 88% of the best spot, shade included
Production estimate
The selected layout is simulated hour by hour over a typical weather year at the address, with module temperature, system losses and the shade model included. Read monthly and seasonal totals, or pick any day for its hourly power curve and the typical range around it.
- Winter
- 8,046 kWh
- Spring
- 10,618 kWh
- Summer
- 13,589 kWh
- Fall
- 10,082 kWh
- System
- 32.68 kW DC
- Panels
- 76
- Generation
- 42,334 kWh/yr
- Yield
- 1,295 kWh/kWp
- Shade loss
- 3.1%
Sample property, Max fill layout with 430 W modules. Typical-year estimate; confirm structure, fire access and shade on site.
A report you can put on the table.
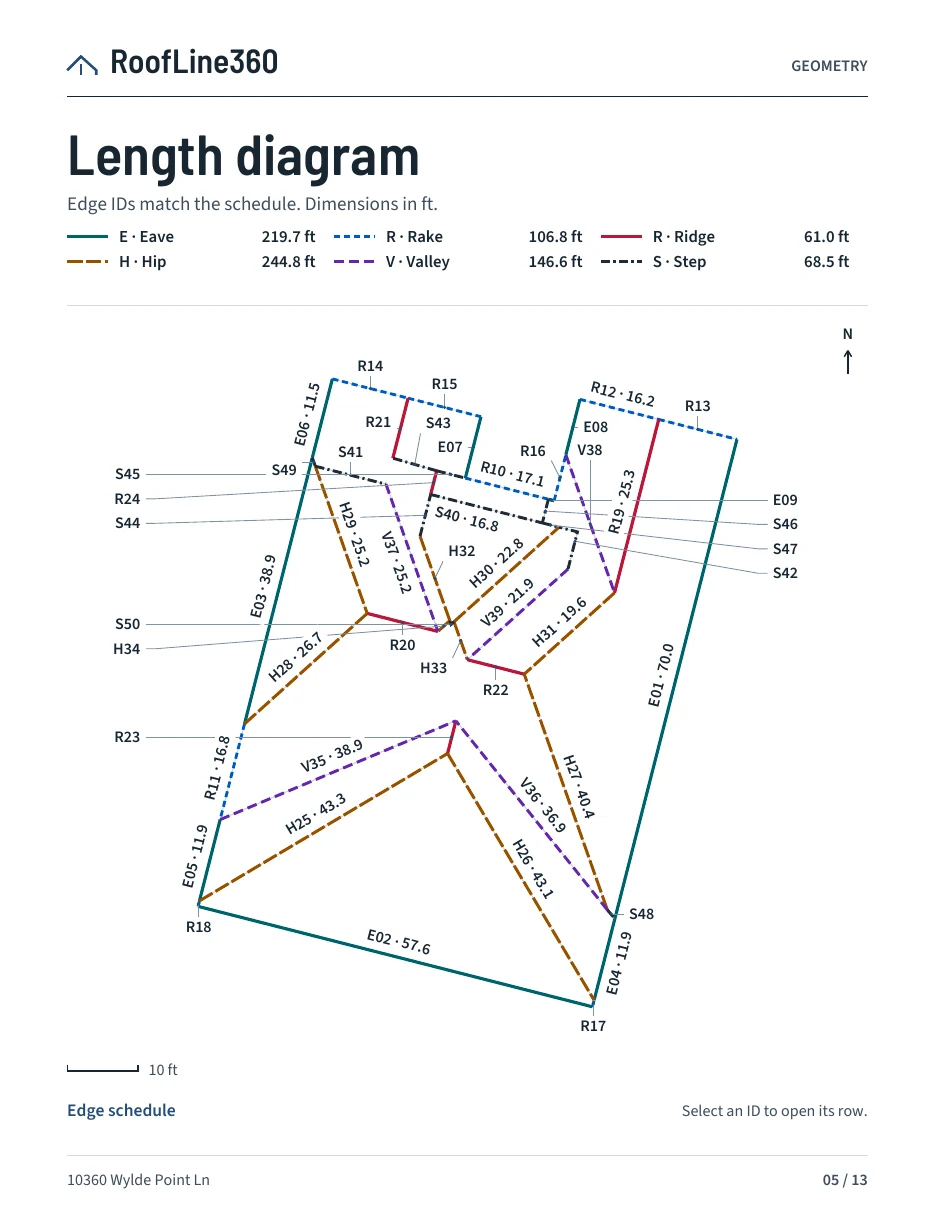
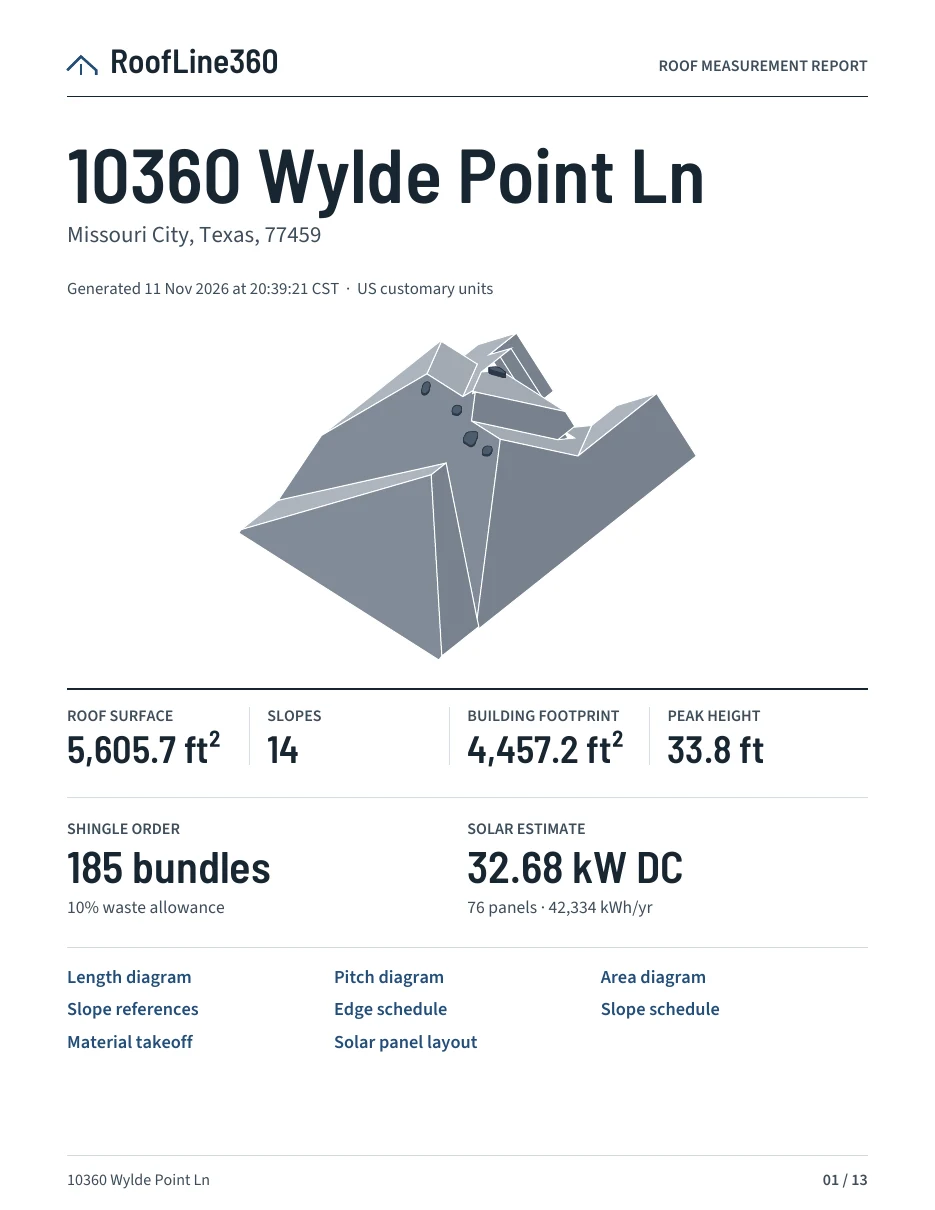
Every model exports a laid-out PDF that reads on a phone or on paper. Edge IDs on the diagrams link to their rows in the schedules and back.
- Length, pitch and area diagramsNorth-up, color-coded by edge type
- Edge and slope schedulesEvery segment with a location thumbnail
- Material takeoffBundles, squares, underlayment, starter, caps
- Panel layout, shade and productionPanels, kW DC, monthly and yearly kWh by slope
Which roof are you quoting next?
Free to try, no account. Your model is ready in seconds.